Design SystemsView case Apollo Design System
Apollo Design System
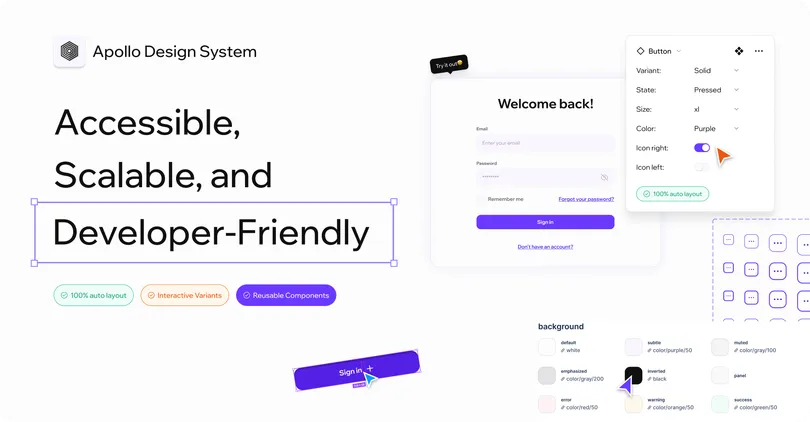
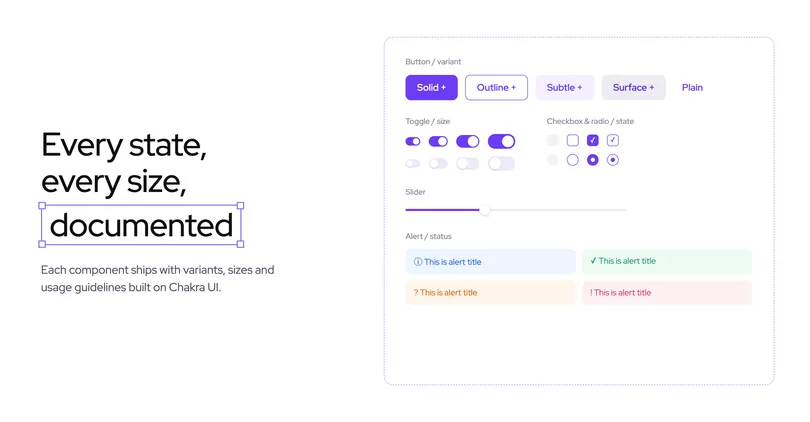
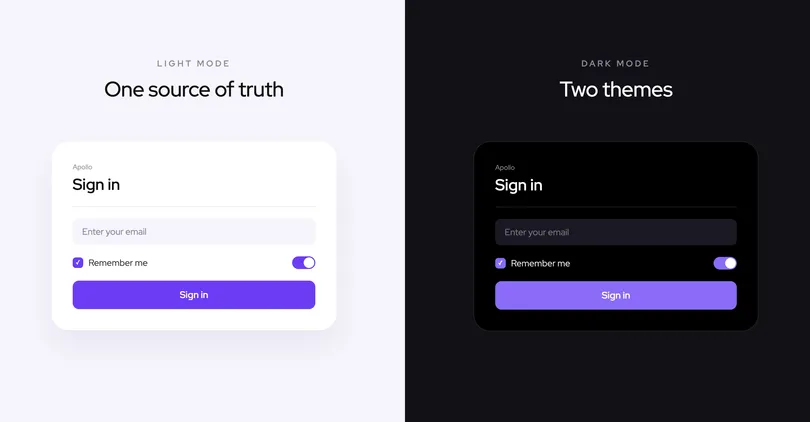
A scalable, developer-friendly design system built on Chakra UI to create consistent experiences across multiple digital products.

A website monitoring platform for tracking uptime, incidents, response times, and service health, with configurable alerts and status pages.
The product combines several connected workflows — monitor setup, uptime tracking, incident investigation, notification management, and account configuration.
As Product Designer, I worked on the end-to-end experience, from creating and configuring monitors to reviewing performance data and understanding individual incidents.
The main focus was to make a technical product easy to scan during everyday monitoring while still providing enough detail when something required investigation.
Making technical monitoring data easy to understand and act on
Monitoring products need to communicate a large amount of information quickly: current status, uptime, response time, incidents, error causes, monitoring locations, and notification settings.
The challenge was to balance fast status recognition with deeper diagnostic information.
Users needed to be able to:
The goal was to create an experience where important changes are immediately visible, while detailed information remains available when users need to investigate further.
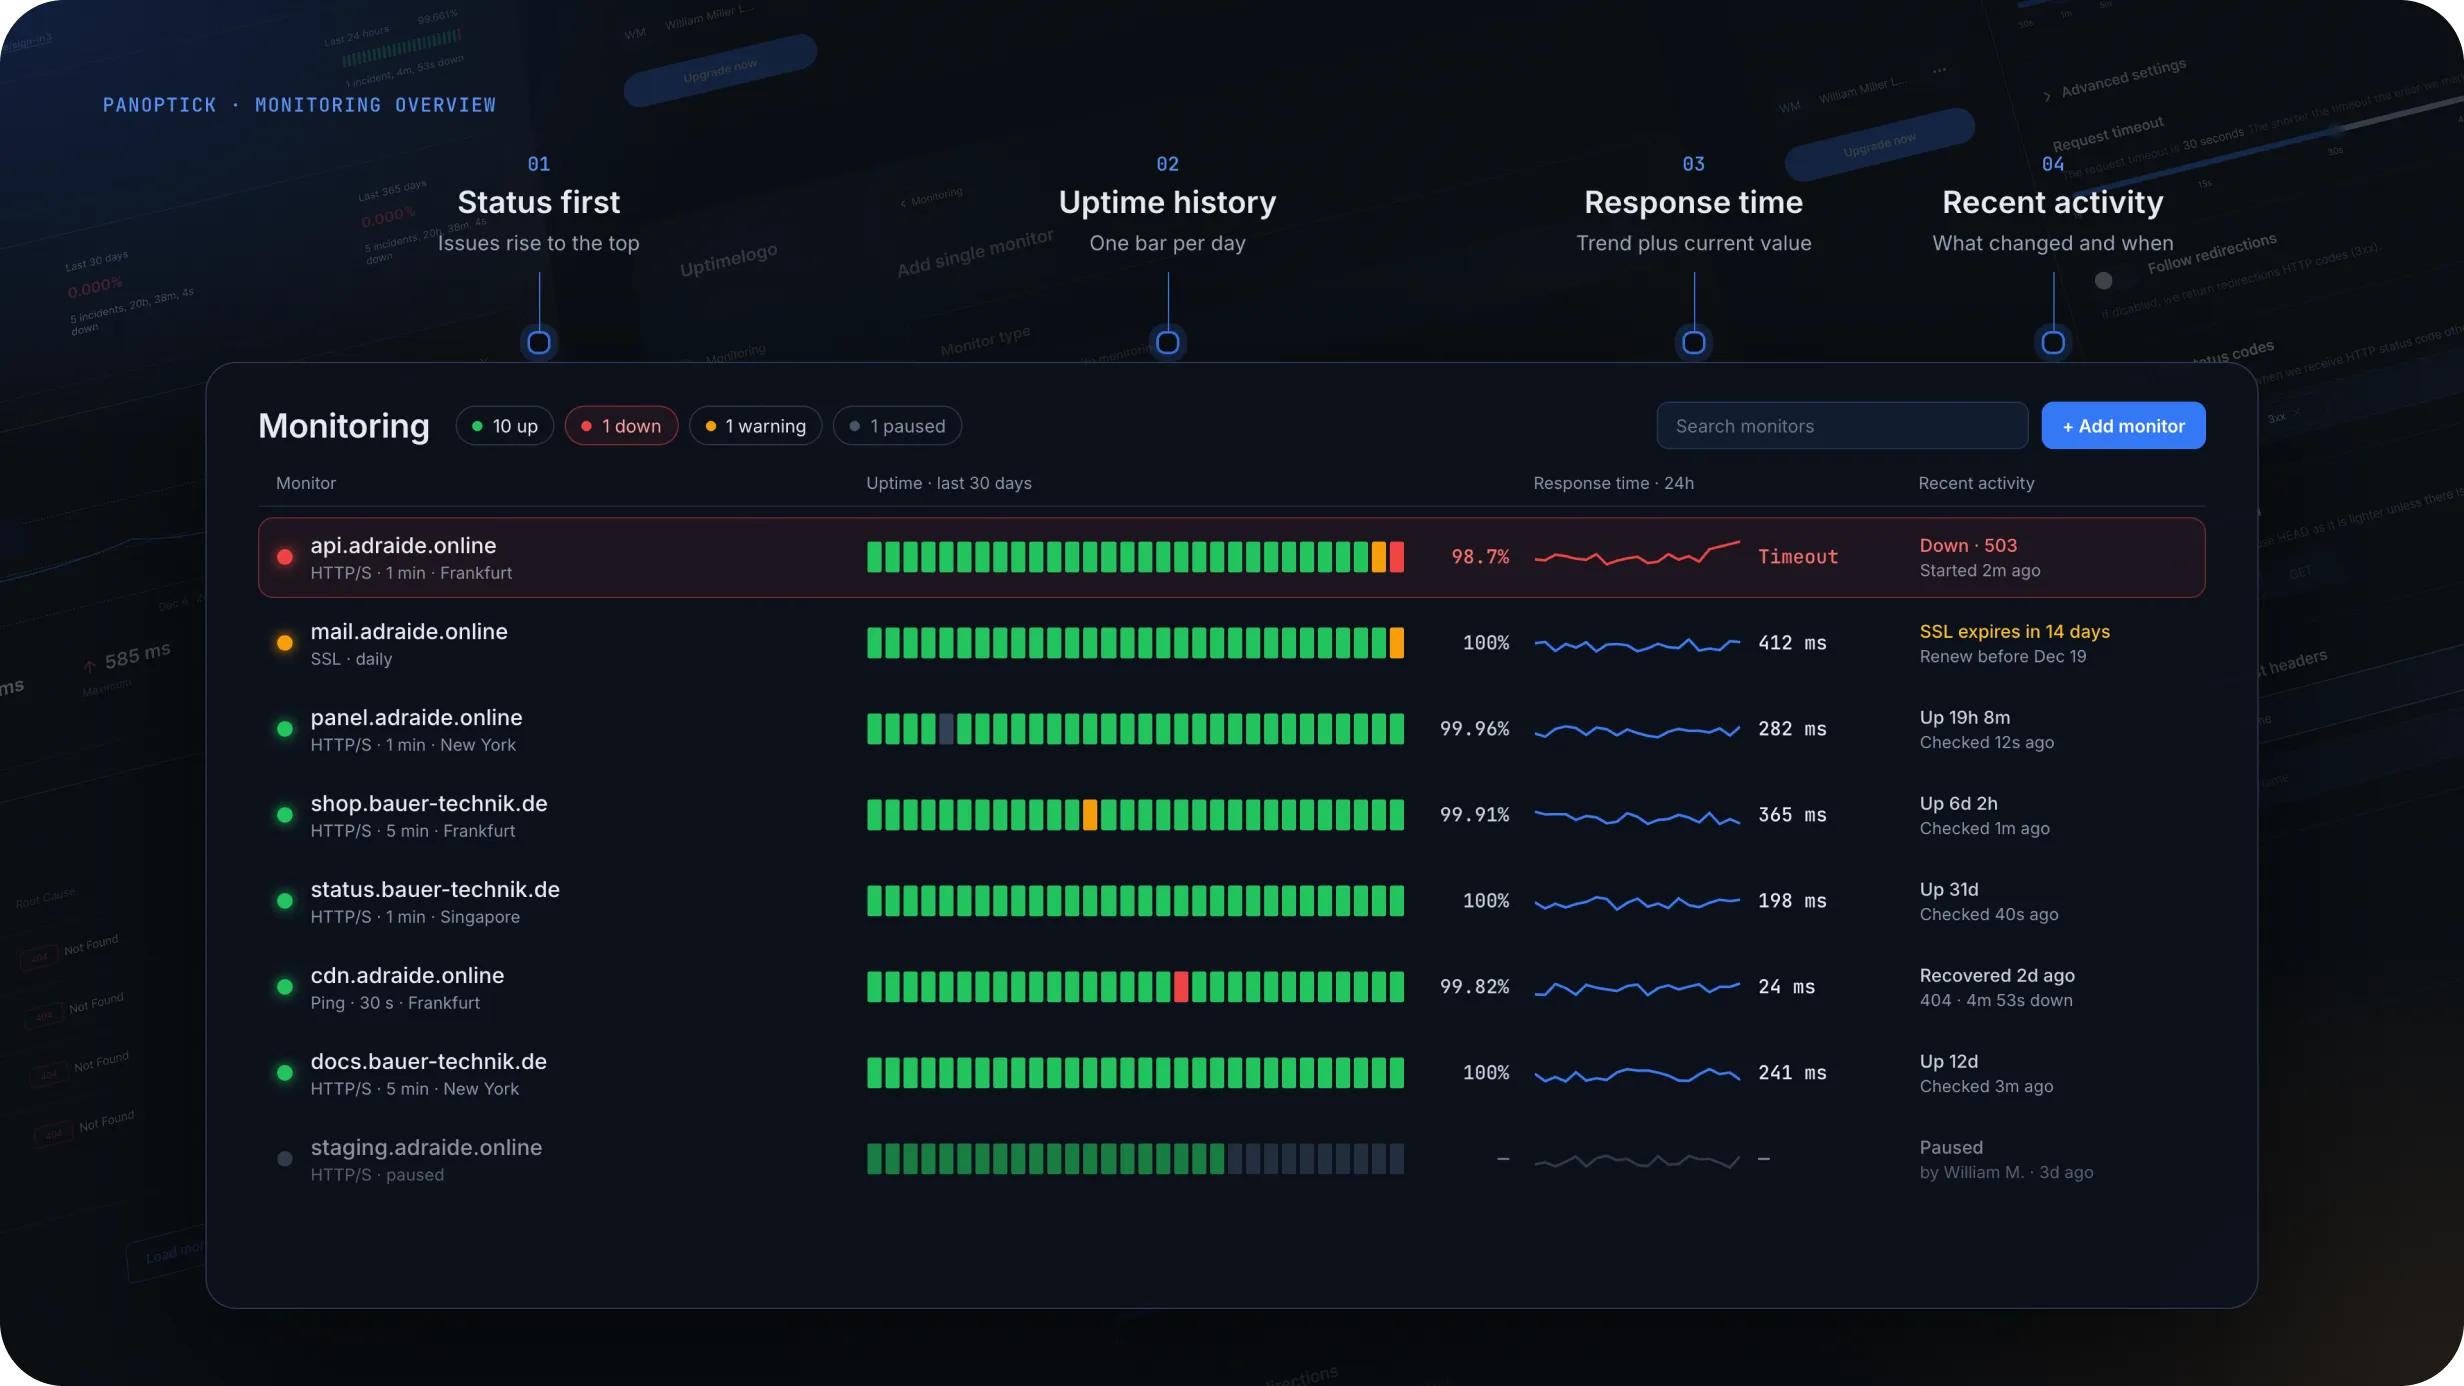
Making system health easy to scan
The main monitoring view was designed to help users understand the current state of their websites and services at a glance.
I focused on creating a clear hierarchy between status, uptime, response time, and recent activity, so users could quickly identify which monitors were healthy and which required attention.
The interface prioritizes scanability, keeping detailed information available without making the overview feel overloaded.
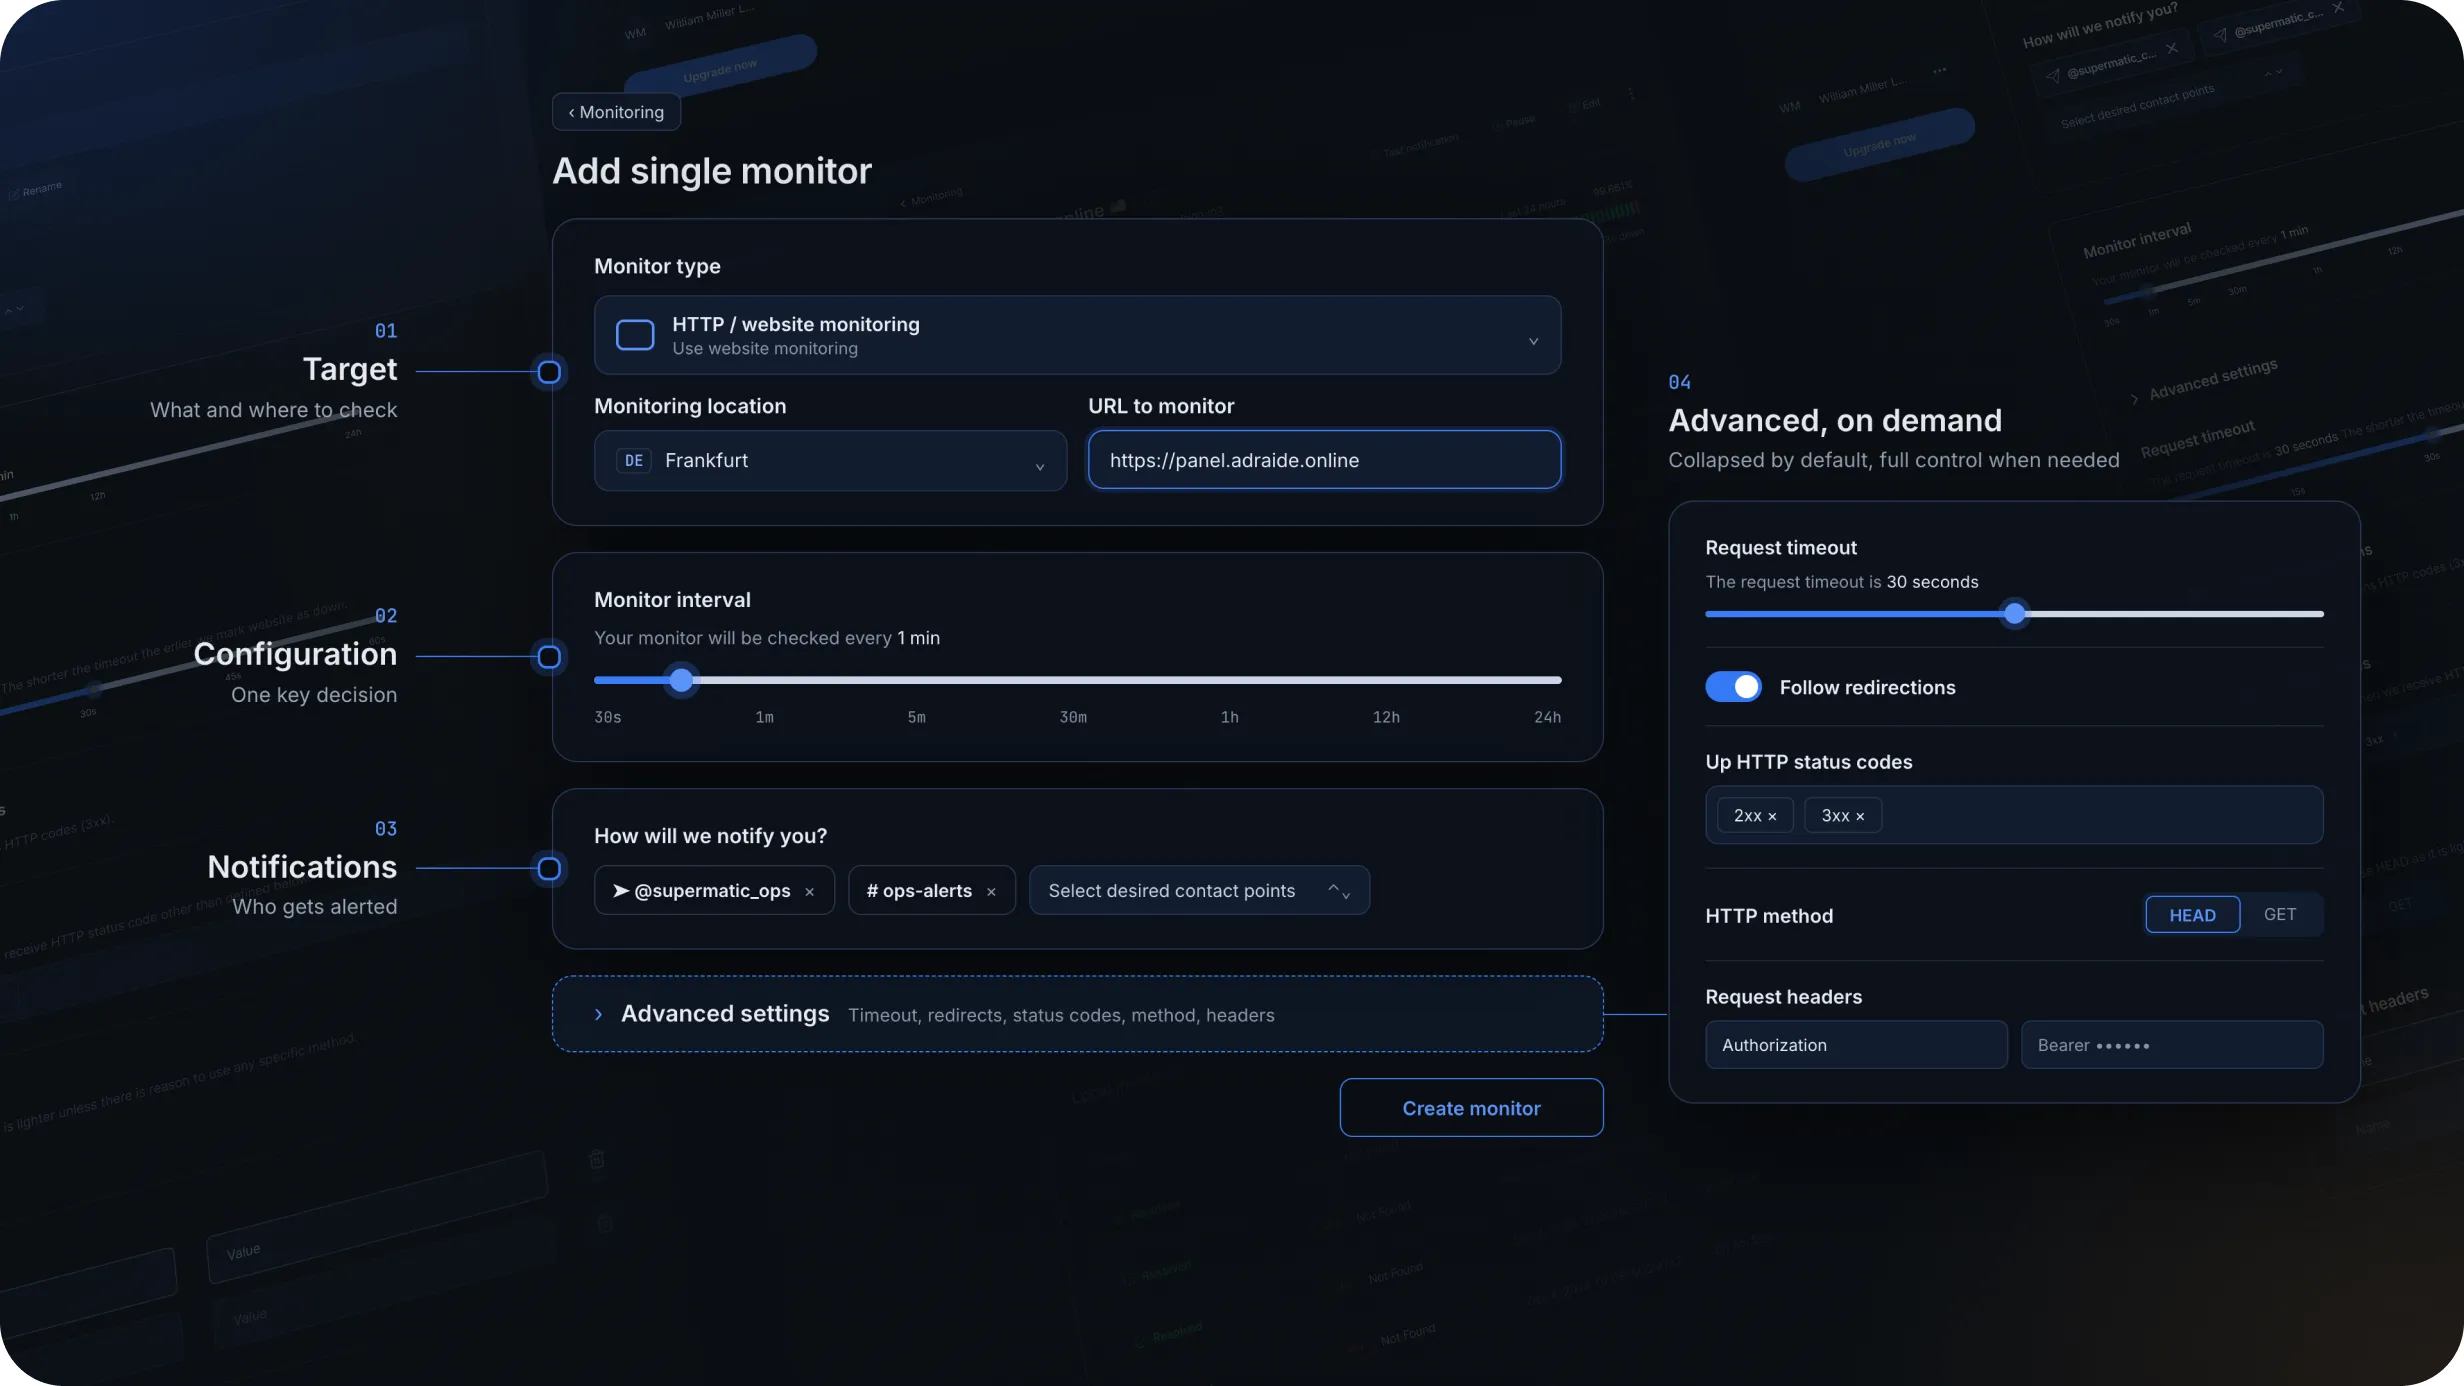
Simplifying configuration without removing control
Creating a monitor requires several technical decisions, but the setup flow needed to remain approachable for users with different levels of experience.
I structured the form around the most important configuration steps first, while keeping more advanced options available when needed.
The goal was to help users move from target selection → monitoring configuration → notification setup through a predictable flow without exposing unnecessary complexity upfront.
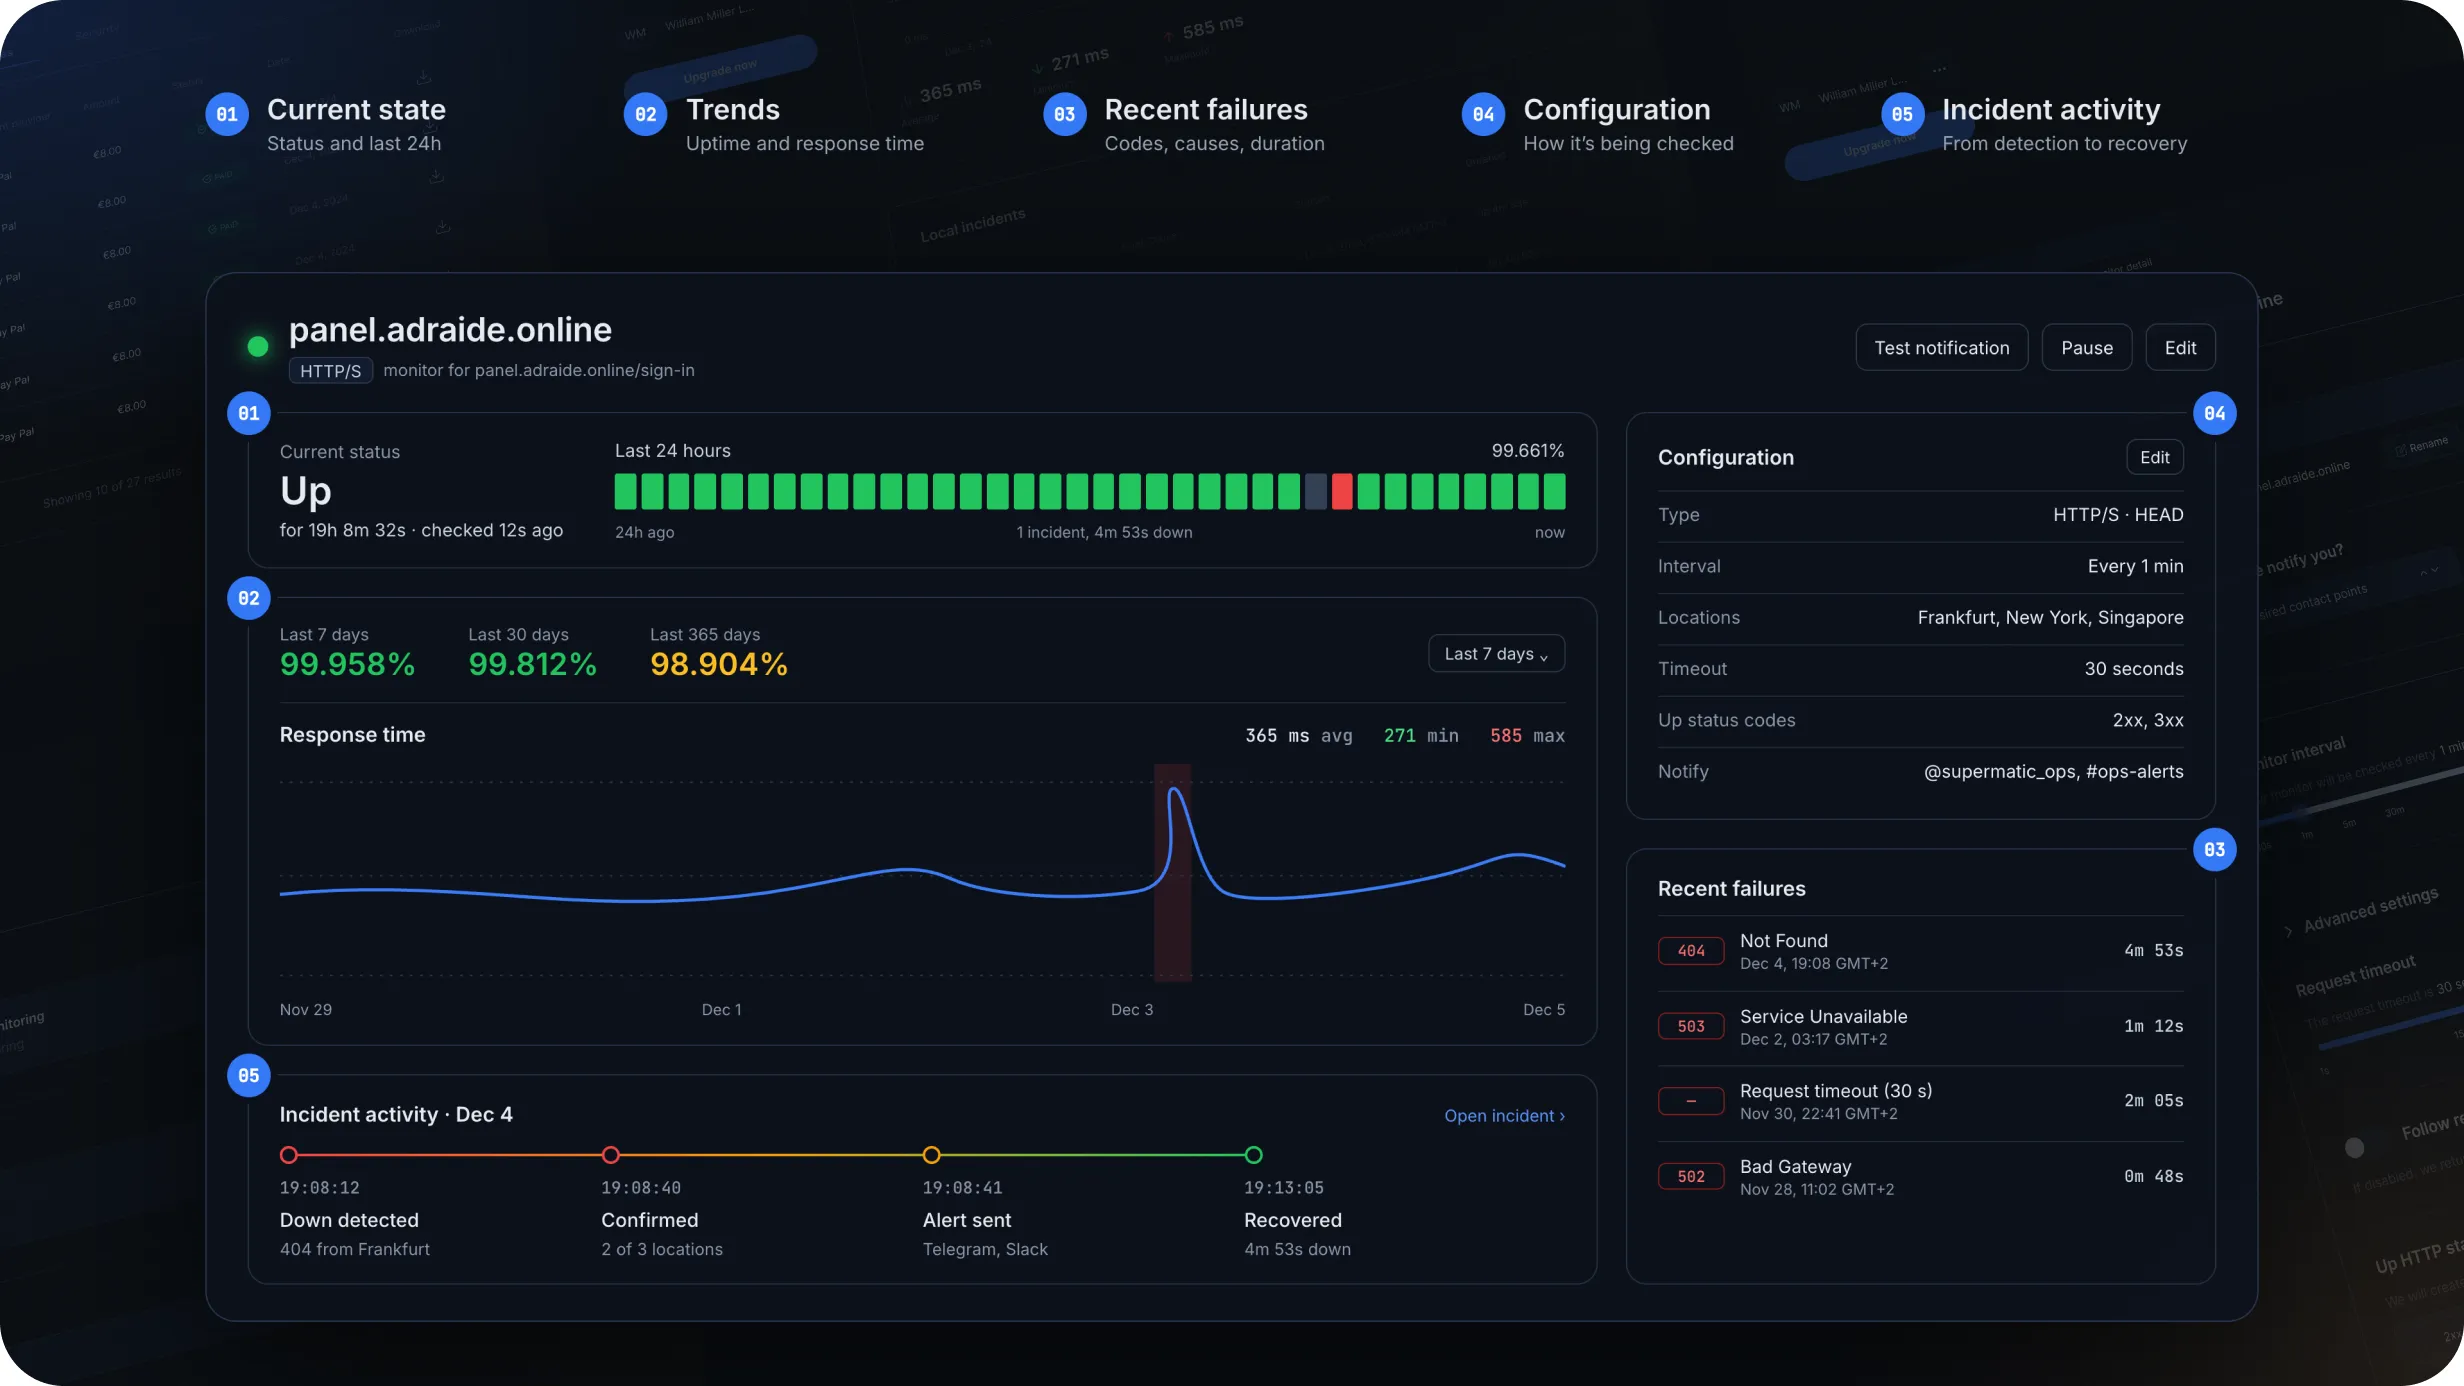
Combining current status with historical context
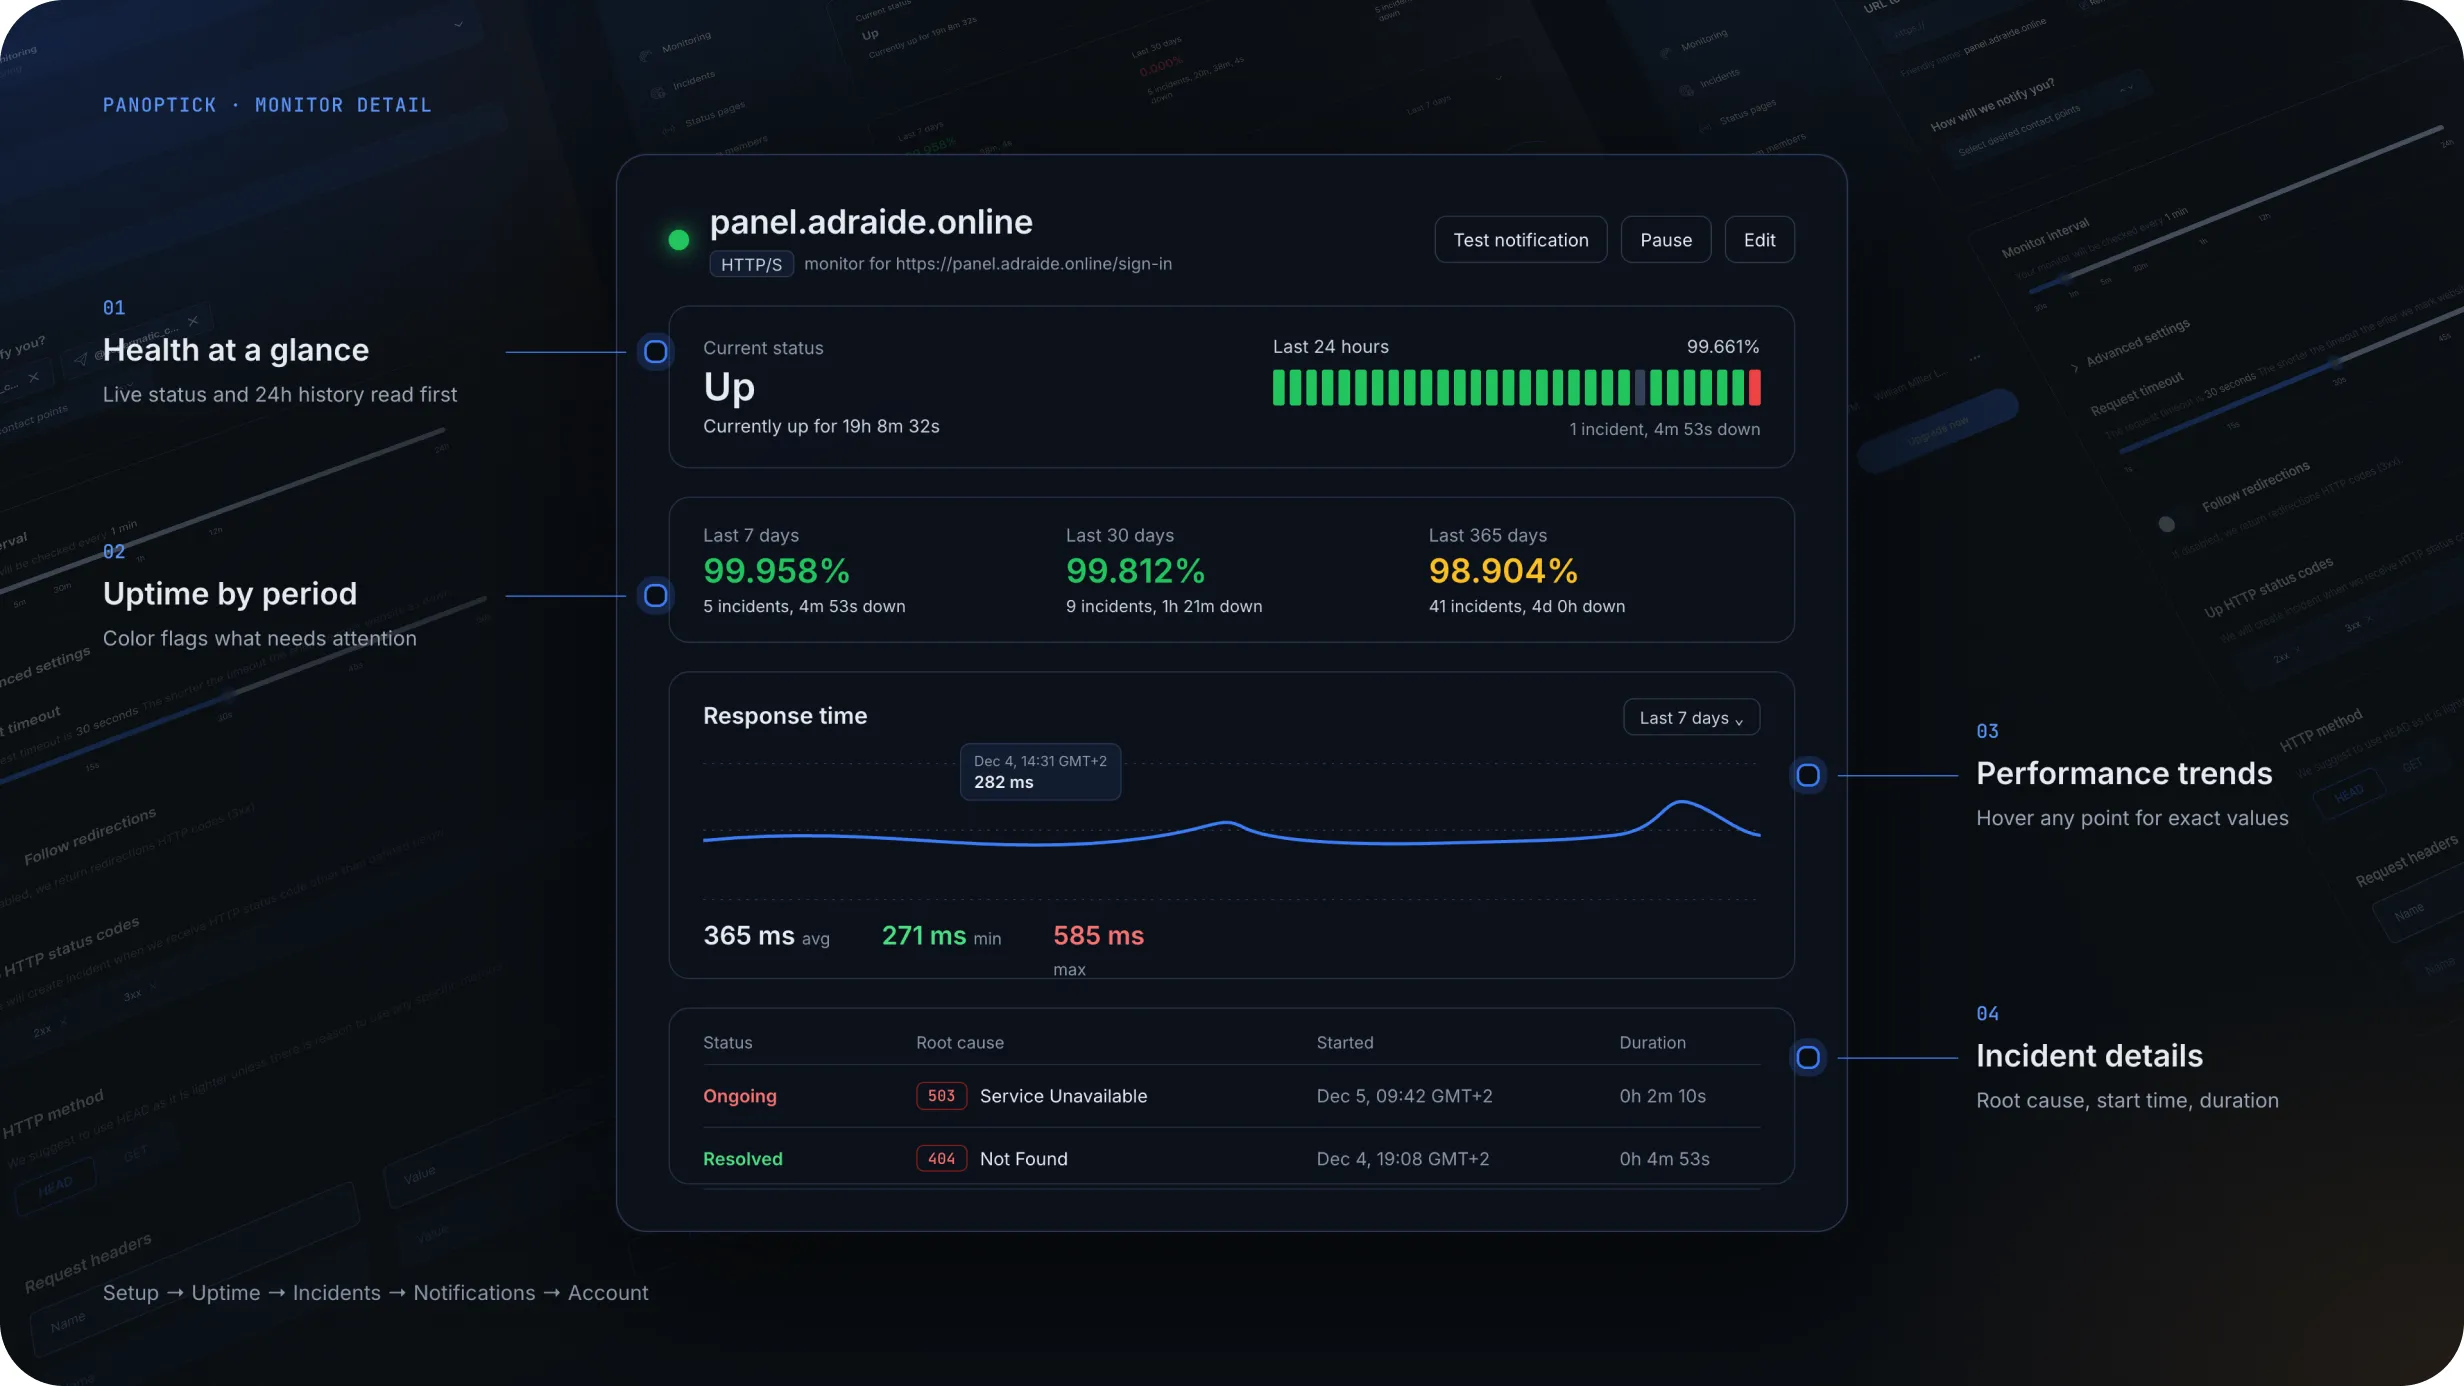
The monitor detail page brings together the information users need when reviewing a specific service.
Rather than separating status, performance, and incident history into disconnected views, the page provides a single place to understand:
This makes it easier to move from a high-level status check to deeper investigation without losing context.
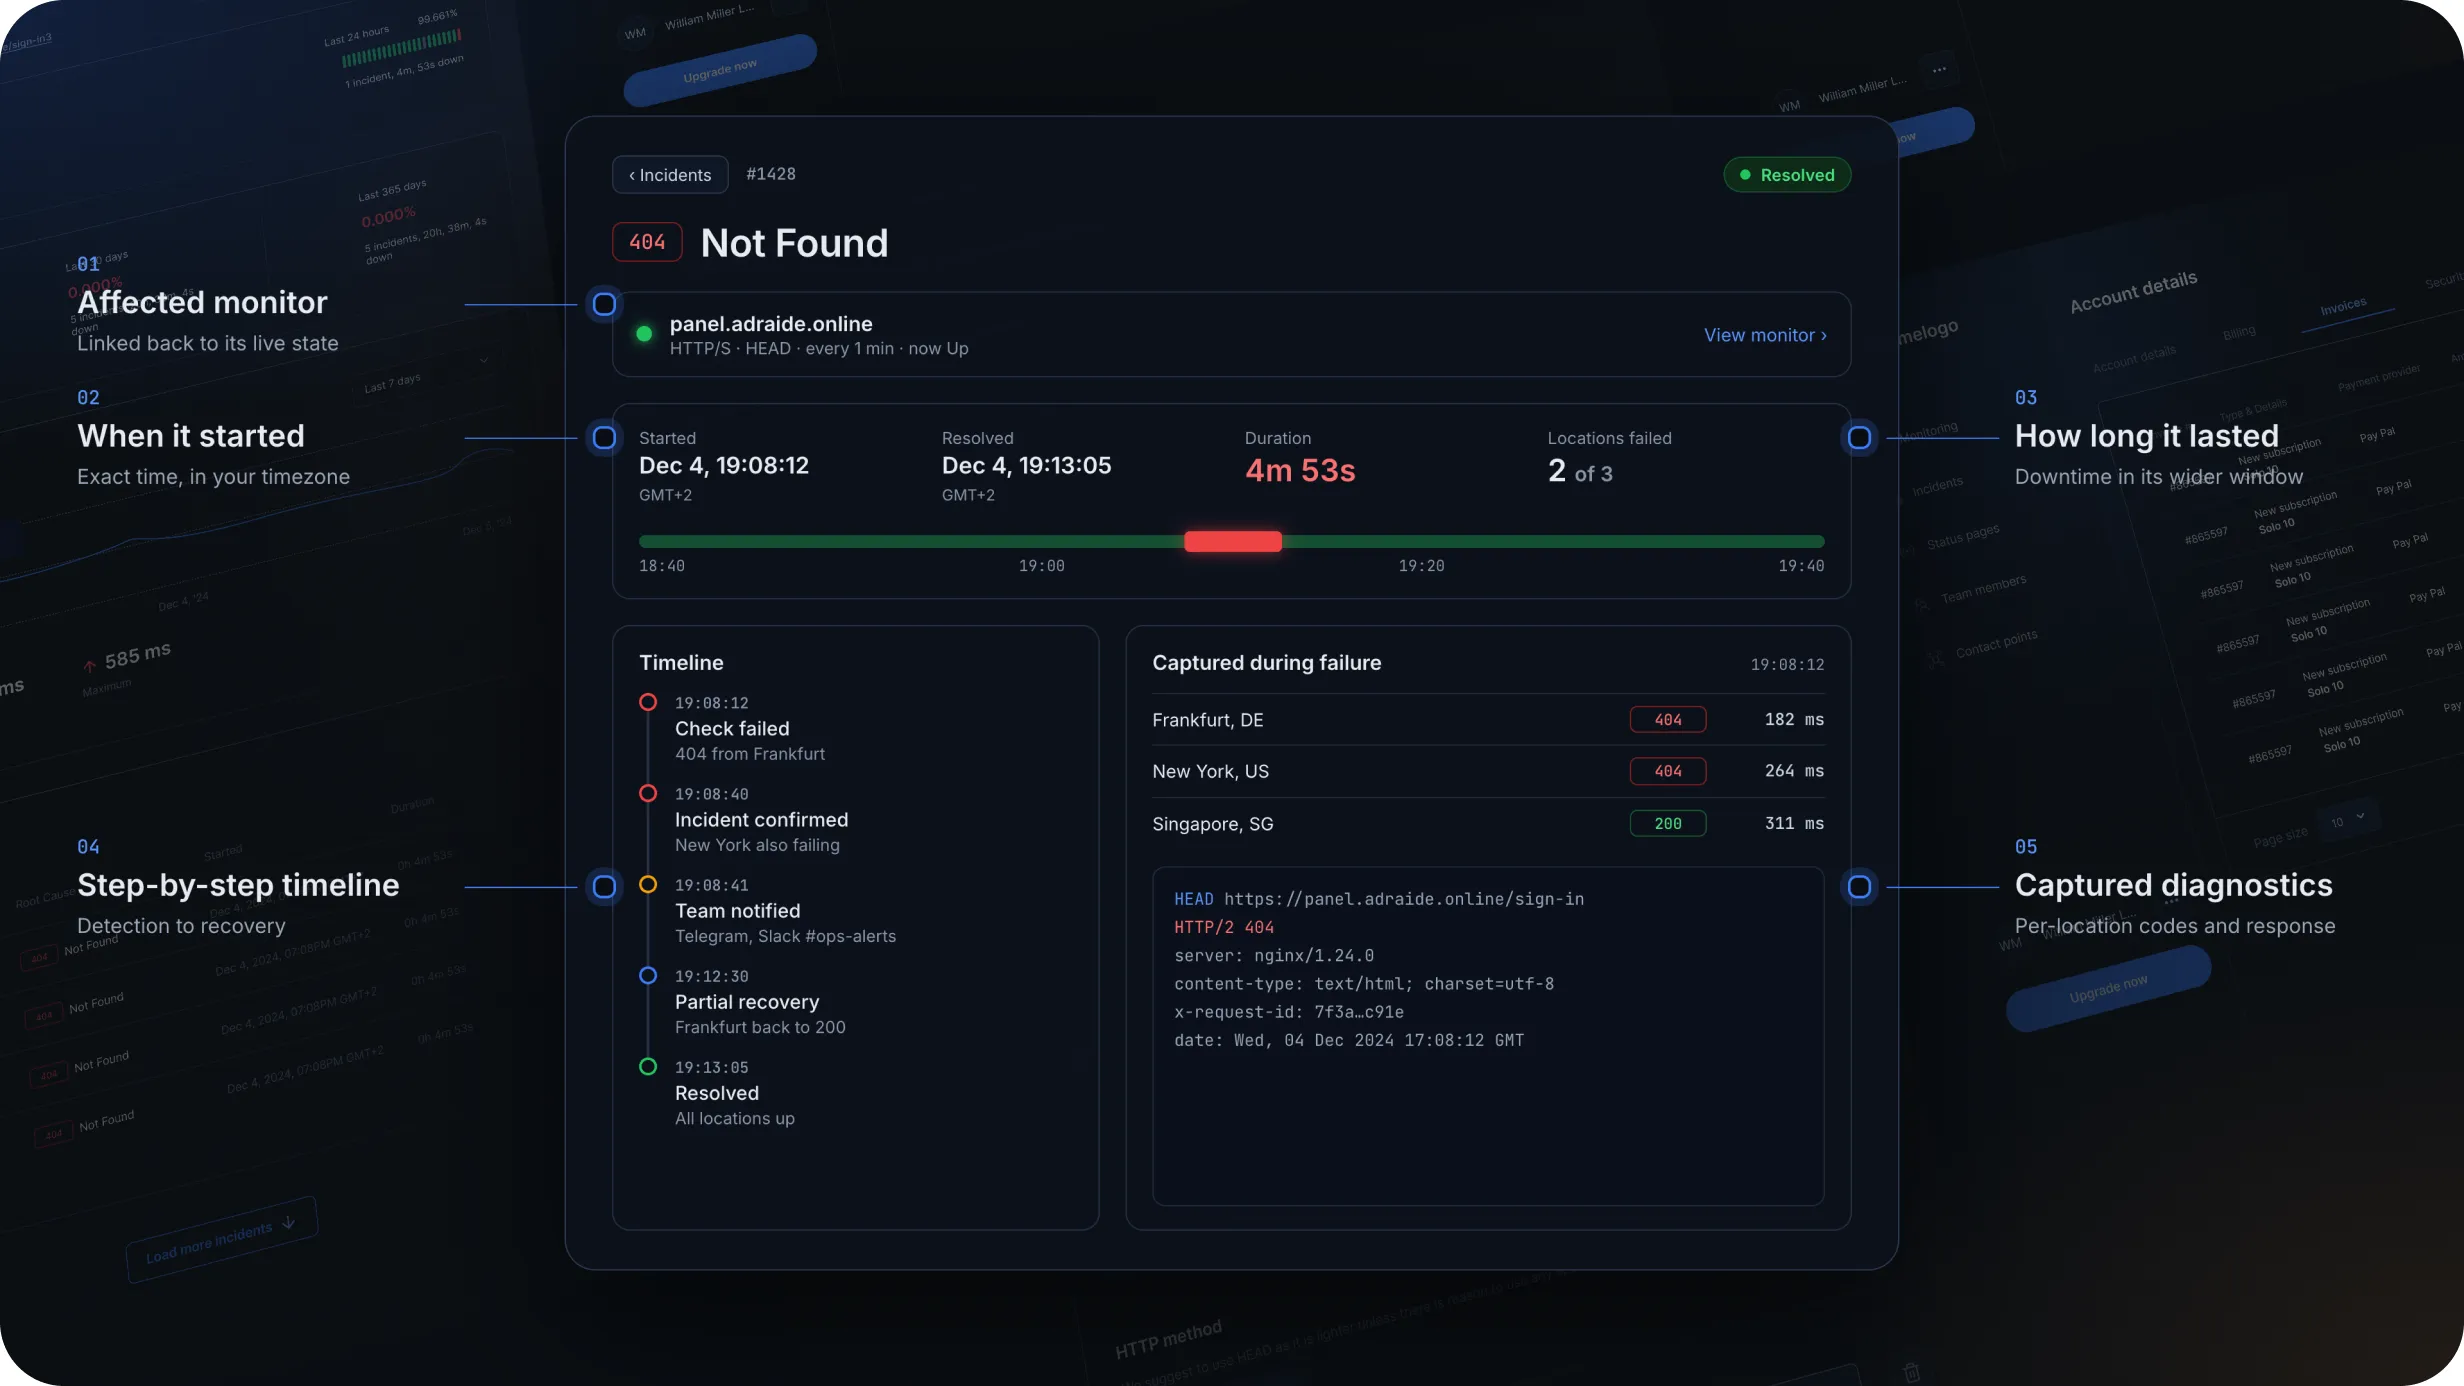
Helping users understand what happened and when
When an incident occurs, the interface needs to support a different type of task: investigation.
I designed the incident experience to clearly communicate when the issue started, how long it lasted, which monitor was affected, and what information was captured during the failure.
The structure keeps the timeline and diagnostic details easy to scan, helping users move quickly from detecting a problem to understanding its context.
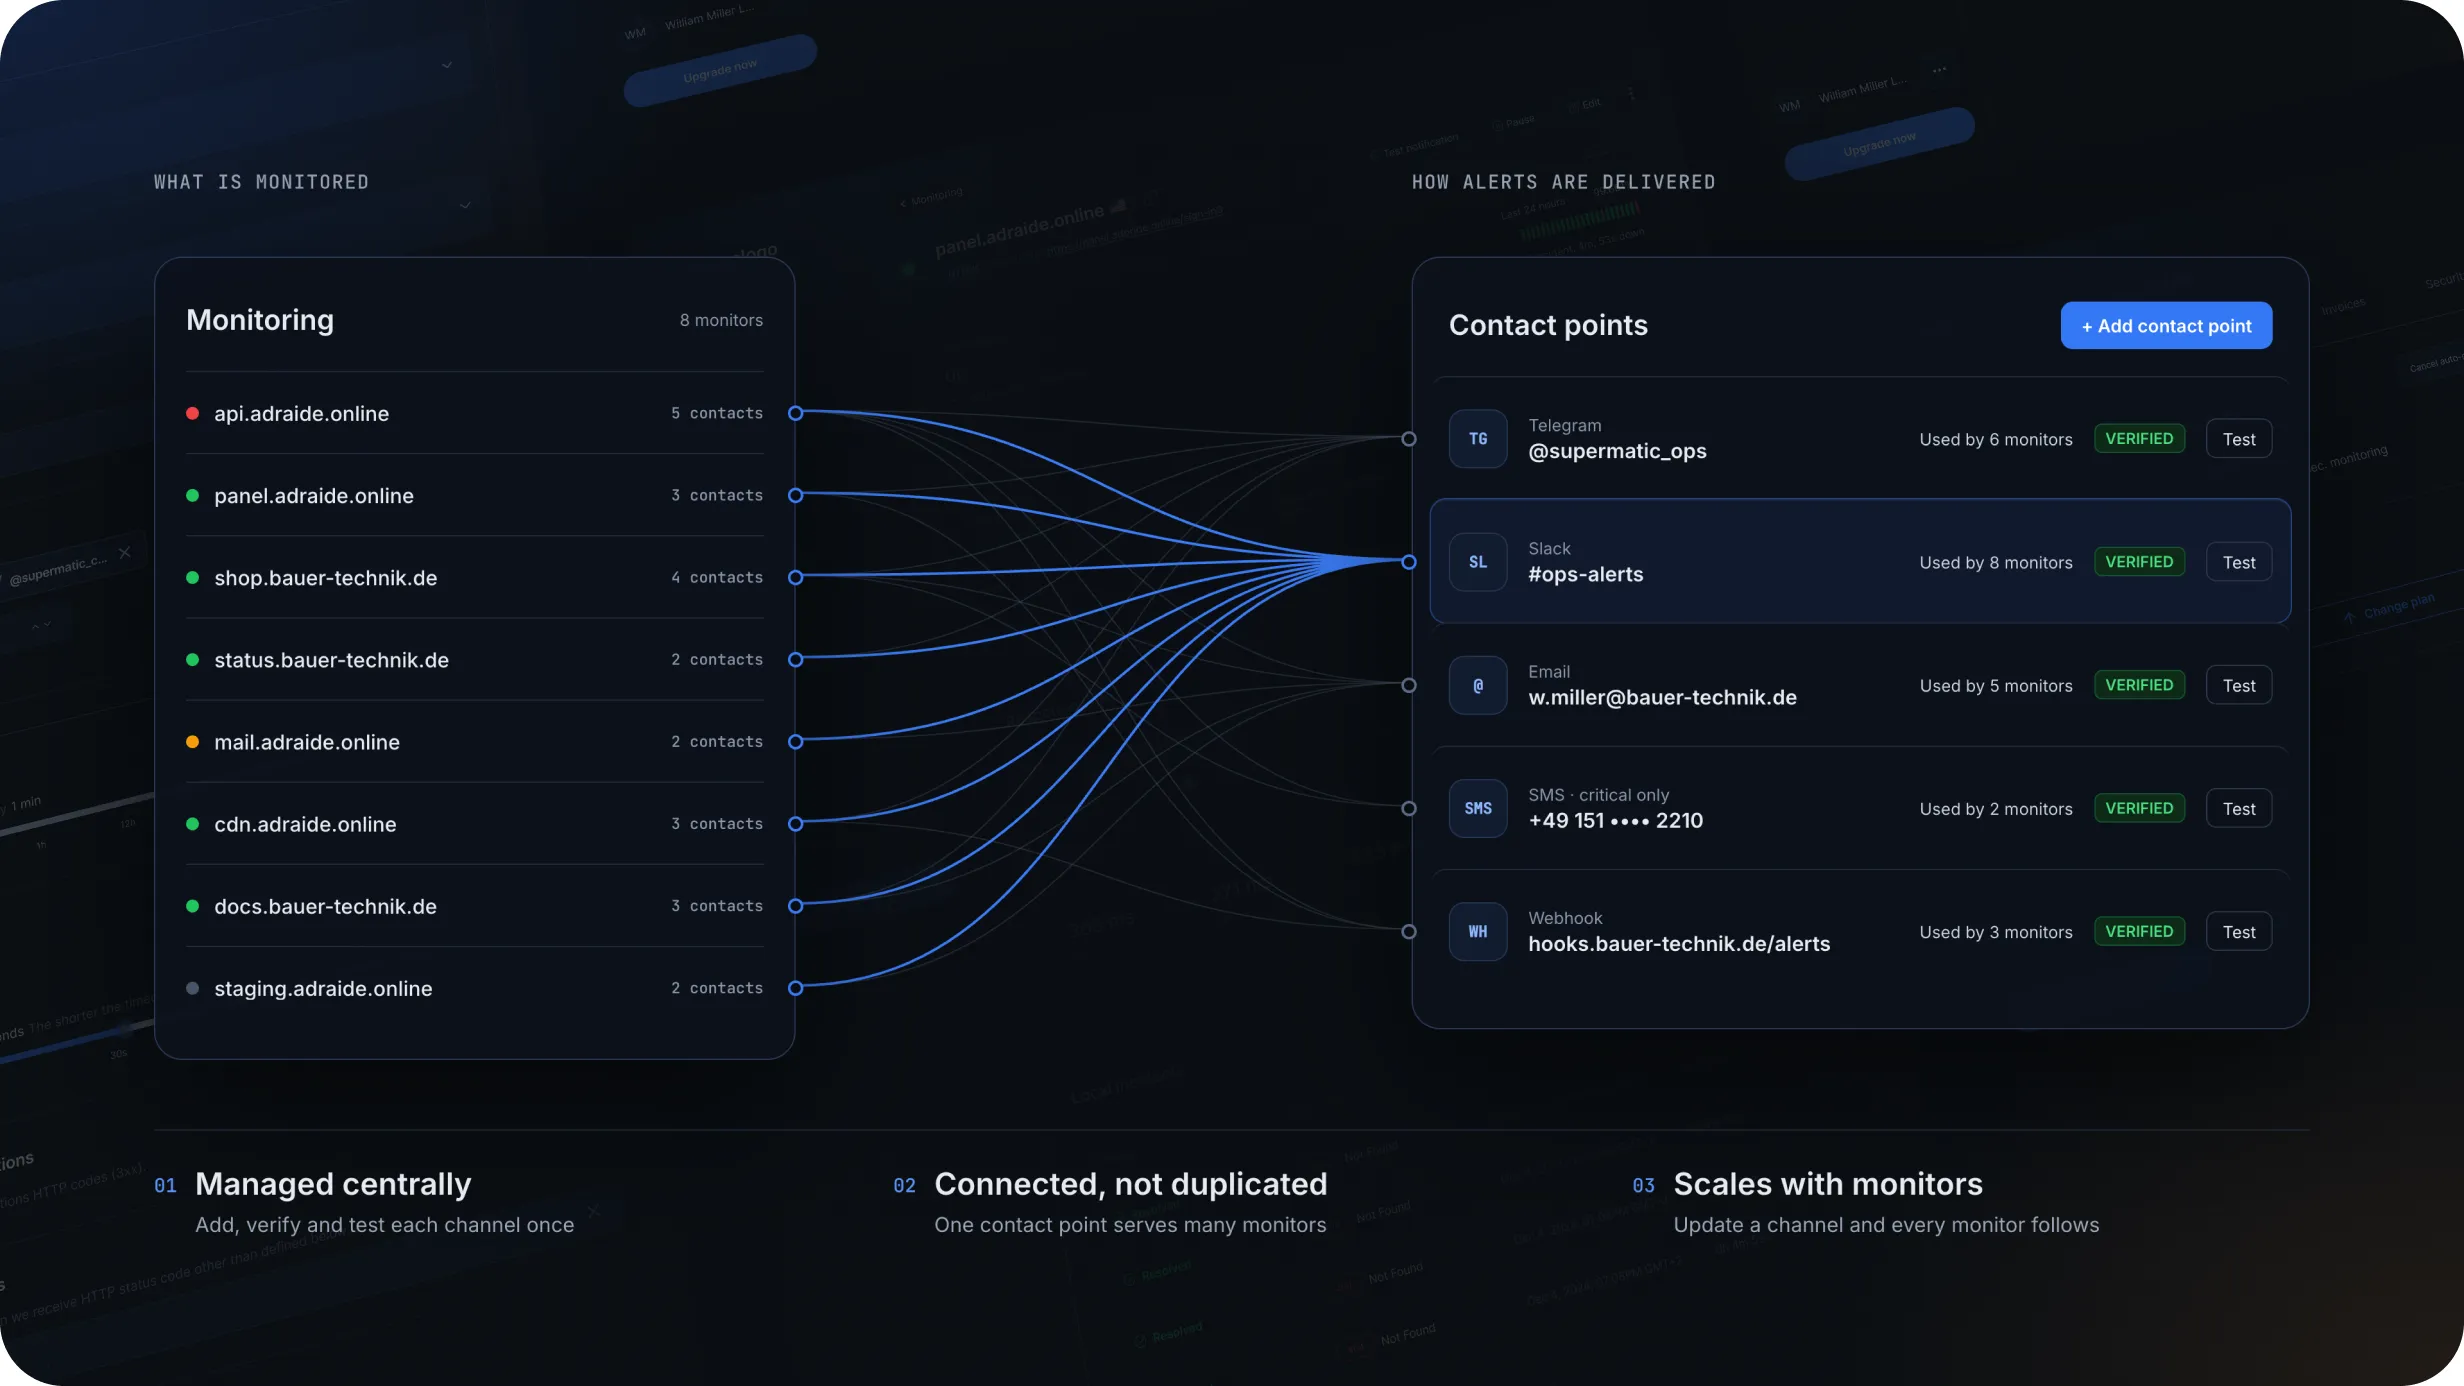
Separating monitoring from alert delivery
Notification settings were treated as a dedicated part of the product rather than being repeated across every monitor.
Users can manage contact points centrally and then connect them to relevant monitoring flows.
This creates a clearer separation between what is being monitored and how alerts are delivered, making notification management easier to maintain as the number of monitors grows.
A clearer operational workspace for website monitoring
The final experience brings monitor configuration, system health, incident investigation, and alert management into one structured product.
The interface was designed to support two different modes of use: quick everyday monitoring and deeper investigation when something goes wrong.
The result is a product that keeps technical information accessible without forcing users to process all of it at once.
This project reinforced how important information hierarchy and state communication are in monitoring products. The main design challenge was not displaying more data, but helping users understand what matters now and where to look when a problem appears.
A scalable, developer-friendly design system built on Chakra UI to create consistent experiences across multiple digital products.